 43
43

Valley grades fall, officials blame new state test
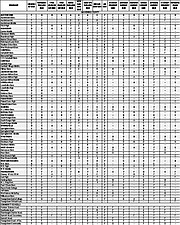
RELATED: • Valley school districts’ grades for indicators met
• Ohio.gov: Download Ohio School Report Cards
By Denise Dick
YOUNGSTOWN
As state and Mahoning Valley educators predicted, the latest state report cards for schools and school districts show lower grades than what many parents and community members expect.
This is the third new test in three years, and the state has raised the benchmarks for performance.
“Teachers didn’t suddenly stop teaching,” said Kim Davis, director of teaching and learning at the Mahoning County Educational Service Center. “The teachers didn’t change. Administrators didn’t change, and the kids didn’t change. Something did change – and that was the test.”
Whenever there’s a new test, it takes a couple of years before schools’ tests scores increase, she said.
“We have to respond to that,” Davis said. “We have to look at what changed and what do we need to do to deal with that. And that’s truly what we’re doing.”
There’s no one letter grade that by itself scores a district’s or school’s performance, she said.
Because tests and benchmarks have changed, comparing how a school or district performed on this year’s report card to last year’s isn’t an “apples to apples” comparison, educators said.
Of the 45 Valley public school districts, just three – Canfield, Poland and Lakeview – earned a B on the Indicators Met measure of the report cards released Thursday by the Ohio Department of Education. That measure shows whether student performance on state tests met established thresholds.
No Valley district earned an A for that measure. Just 23 school districts of the state’s 615 earned an A.
Four Valley districts earned C’s in that category, 14 got D’s and 24 got F’s.
Districts and schools were graded on six components for the 2015-16 school year. The components are Achievement, Progress, Gap Closing, Graduation Rate, K-3 Literacy and Prepared for Success. Though the department has given letter grades for many of the individual measures within the components for several years, letter grades on each of the six components are new this year.
“There are many ways that parents and communities gauge the success and improvement of schools and districts. The report card is one of them,” Paolo DeMaria, state superintendent of public instruction, said in a news release. “At the same time, we know schools and districts will use these report cards to have discussions about performance and make decisions about instruction and improvement strategies.”
Youngstown city schools got no A’s, one B, two C’s, one D and 12 F’s.
“I think it’s a good baseline for us to look at the data and build a plan,” said Krish Mohip, the city schools’ chief executive officer.
He’ll use the data from the state to identify trends and determine the best ways to improve.
“This is not a direct reflection of the passion and dedication of the teachers we have,” Mohip said. “We have to use all of the resources of the district and provide all of the needed support.”
Warren, the Valley’s other urban district, get no A’s or B’s, three C’s, three D’s and 10 F’s.
Just Canfield, Poland and Girard earned no F’s among the 16 measures and components graded in the report cards.
“I’m certainly proud of our students, staff and administrators,” said Poland Superintendent David Janofa. “But there’s chaos in Columbus relative to these report cards. This is the third testing company in three years. We’re overburdening our kids with all of these tests.”
A B in Indicators Met puts the three Valley school districts among the state’s top 8 percent, but a lot of other good school districts in the area got lower grades. Indicators Met is based on 31 state tests that measure the level of achievement for each student in a grade or subject.
Janofa doesn’t think that accurately represents what happens in those districts.
“It takes a whole lot more than just these tests to identify how students are progressing,” he said. “Every superintendent I’ve talked to understands and accepts the need for accountability including myself.”
Districts that earned the highest grades in the Indicators Met category are some of the highest-wealth districts in the state, Janofa said.
Poland got four A’s, three B’s, three C’s, four D’s and no F’s. A grade wasn’t assessed for one measure.
DeMaria said the system is changing.
“Ohio has raised expectations for students to reflect what is necessary for them to be successful in college, careers and life,” DeMaria said. “This year’s report cards and the grades we’re seeing reflect a system in transition. “They reflect new tests, higher achievement targets and more challenging expectations.”
Canfield got five A’s, six B’s, five C’s, no D’s and no F’s.
“We always view ourselves as hopefully a leader of the pack,” said Alex Geordan, Canfield superintendent.
But report card grades aren’t the only measure of a school district’s effectiveness, he said.
“It’s one tool, one piece of the puzzle,” Geordan said.
Other pieces include students’ need for remediation in college courses and whether students are prepared for college and careers.
Across the state, it usually takes a year or two with the same tests before districts’ scores get better, he said.
“We have learned in our profession to be flexible and to be able to adjust,” Geordan said.
Austintown Superintendent Vince Colaluca agrees with his colleagues from other districts: Report cards aren’t the whole measure of how well schools are educating students.
“There’s no overall grade,” he said. “There won’t be until 2018.”
On the measures that evaluate a year’s worth of students’ growth, Austintown earned three A’s and a C.
His district earned an F in the Indicators Met measure. Of the 16 measures and components, the district got three A’s, four B’s, one C, three D’s and five F’s.
The data underlying the grades are where he and his staff will determine where to make changes to help students.
Boardman schools racked up two A’s, a B, six C’s, a D and seven F’s.
Boardman Superintendent Timothy Saxton said the report cards give just a snapshot. It’s just how students performed on one day on one test, he said.
He’s happy with the graduation component grade, an A. That shows the district is accomplishing what’s expected in that category.
Saxton isn’t satisfied with many of the other grades. He plans to analyze the data to determine where to make changes.
While the district’s K-3 Literacy component shows an F, 100 percent of the district’s third-graders met the Third-Grade Reading Guarantee requiring that students read at grade level before advancing.