 43
43

School report cards show mixed results for Valley schools
By Denise Dick
The latest state school report cards are supposed to give parents, educators and the general public a clearer picture of how schools are doing, but some Mahoning Valley superintendents believe it makes it more difficult to understand.
“This represents a big change in the way we deter- mine how well our schools are educating our boys and girls,” Richard Ross, state superintendent of public instruction, said Thursday. “Our goal is to create transparency for our customers.”
Rather than the system of designations from “excellent with distinction” to “academic emergency,” the new system uses an A-F grading system.
But because the new system is being phased in, there’s no overall grade for schools or districts.
Ross said the old system concealed areas where schools were doing a poor job.
No district in the state earned all A’s and none received all F’s, the state superintendent said. The new system is intended to show schools and the public the strengths and weaknesses of each school and district.
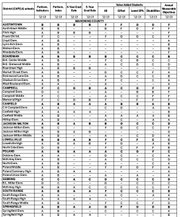
In the Mahoning Valley, the results were mixed. Canfield, for example, racked up all A’s and B’s, while Poland got four A’s, a B, two C’s, a D and an F. Canfield was designated “excellent” last year, and Poland was “excellent with distinction.”
Those superintendents couldn’t be reached for comments.
The continual changes to the system and the targets schools and districts must hit present challenges, said Liberty schools Superintendent Stan Watson.
“This is a game where the rules weren’t defined at the start of the season,” he said. “It’s tremendously frustrating. The targets continue to move. You just get your focus narrowed and you get zeroed in where you think you need to be, and the target changes. It happens continuously. If it made it simpler for the average person to understand, that would be one thing; but I think you’d be hard-pressed to argue that this is simpler.”
The state graded each district in nine components: performance indicators, performance index, overall value added, valued added for gifted, value added for students with disabilities, value added for the lowest 20 percent of students, four- and five-year graduation rates and annual measurable objectives.
Performance indicators measure the level of achievement for each student in a grade and subject.
Performance index measures the achievement of every student, not just whether they reach proficiency.
Four-year graduation rate includes those students who earn a diploma within four years of entering ninth grade for the first time.
Five-year graduation rate includes those students who graduate within five years of entering ninth grade for the first time.
Value added — all students measures whether or not a school or district met a year’s growth for all students.
Value added — gifted measures whether a year’s growth was met for students gifted in math, reading or superior cognitive ability.
Value added — students with disabilities measures whether a year’s growth has been met for students who have an Individual Education Plan and who take the Ohio Achievement Assessment.
Value added — lowest 20 percent of achievement measures whether a year’s growth has been met for students in the lowest 20 percent based on distribution of scores for the state.
Annual measurable objectives measure the academic performance in reading, math and graduation rates among specific racial and demographic subgroups ranging from minority students to those who are economically disadvantaged.
Liberty schools, designated “excellent” on last year’s report card, earned one A, four B’s, a C, a D and an F this year. The F was in annual measurable objectives.
Watson said the higher grades in the value added categories show that students are continuing to achieve a year’s growth. The district needs to focus more attention on the subgroups, he said.
Austintown, which received the highest rating of “excellent with distinction” on last year’s report card, saw four B’s, two D’s and three F’s.
“We didn’t change what we’re doing,” said Austintown Superintendent Vince Colaluca. “The report cards changed. We still have great kids, and we’re still doing great things in our school system.”
The state not only raised the targets for racial and demographic subgroups, it also eliminated some of the provisions that had allowed the district to earn credit for improvement for some students, he said.
“The system is changing, and we’ll change along with it,” Colaluca said.
The district met 20 of 24 performance indicators.
“We’re very proud of that,” he said.
Youngstown, which was in “academic watch” last year, earned five F’s, two D’s and two C’s this year.
“We made some progress,” said Superintendent Connie Hathorn.
He said he’s not happy with the latest results and is still reviewing the data.
“The data gives us something to look at — and that’s a good thing,” Hathorn said.
The report cards were supposed to be available in interactive form on the Ohio Department of Education website, but the site crashed throughout the day — a problem that the department attributed to heavy traffic.
Some districts weren’t even able to access their data.
Boardman was designated “excellent” last year, and this year, the district earned an A, five B’s and three C’s.
“I think the intention of ODE is a good one,” said Boardman Superintendent Frank Lazzeri. “They want parents to better understand how their schools are doing. The other designations were difficult for people to understand. Everyone understands A, B, C, D and F. It’s a step in the right direction in terms of understanding the data.”
He hopes the ODE provides a guide for parents to explain the new system. Lazzeri wasn’t able to access his own district’s data from the ODE website Thursday.
As the start of school draws near, each day that the district can examine the data to determine strengths and weaknesses and decide how to proceed matters, he said.